คู่มือสร้าง Lark Dashboard 2026: ติดตามธุรกิจไม่ต้องเขียนโค้ด

คู่มือนี้เขียนให้เจ้าของธุรกิจ, ทีม Operations, และ SME ไทยที่อยากมี Business Data Tracking Dashboard EN: แบบไม่ต้องเขียนโค้ดเลยสักบรรทัดเลยนะ ใช้{' '}...LarkEN: {' '} ซึ่งเป็นแพลตฟอร์ม collaboration ที...
What can you gain from reading this?
- รู้ว่า Lark Dashboard มันคืออะไร ทำอะไรได้บ้าง
- Step-by-Step Guide to Creating a Dashboard: It's Very Easy!
- 12+ Graph Types You Can Use in Lark with Examples
- Use Cases for Thai Businesses: Sales, HR, Operations
- Free Dashboard Template Feel free to use it.
- Comparing Lark vs Excel vs Google Sheets.
Not available here: Complicated processes that can be frustrating or require coding.
What exactly is Lark Dashboard?
Explain it simply for better understanding.
Lark Dashboard It's a dashboard that consolidates all business information in one place.Lark Base):
- Transform data into Beautiful graphs Instantly and in real-time.
- Check Key Performance Indicators (KPI) Everything you need on one page, no more endless clicking.
- Feel free to share it with the team. Avoid the hassle of sending Excel files back and forth.
- Open on Mobile phone Available anytime, anywhere.ดาวน์โหลด iOS/Android App)
| Feature | รายละเอียด |
|---|---|
| ประเภท Block | 36 types (Charts, Metrics, Tables) |
| ประเภท Charts | 12+ แบบเลยนะ (Column, Line, Pie, Radar ฯลฯ) |
| อัปเดตข้อมูล | Real-time updates (when data changes, the dashboard refreshes). |
| รองรับมือถือ | Yes, (Lark App iOS/Android) |
| ราคา | It's free! (Free plan available) |
The best is: No need to write complicated formulas or create pivots.
Why use Lark Dashboard? (Compared to Excel/Google Sheets)
Everyday problems with Excel/Google Sheets (frustrating issues)
| ปัญหา | Excel/Sheets | Lark Dashboard |
|---|---|---|
| ส่งไฟล์ไปมา | I have to email/LINE every time, it's really tiring. | Share a single link and it's done. |
| ข้อมูลเก่า | You need to update it yourself; just one forgetful moment. | Real-time automation is here. |
| สร้าง Chart | I have to recreate it every time, it's so frustrating. | Drag and drop, done in just 1 minute! |
| ดูบนมือถือ | I can’t see anything at all, it’s really bad. | The app is fully supported. |
| แจ้งเตือน | There isn't any. | Set up Automation now. |
| ทีมแก้ไขพร้อมกัน | It often breaks down. | Working together smoothly is highly efficient. |
What are the benefits of Lark?
- 1Truly real-time. — Where does the data change? The dashboard updates immediately.
- 2No need to repeat the formula. — Create it once and use it endlessly.
- 3Automated Notifications - Achieving or falling short of targets will trigger a notification.
- 4Permissions can be set. - Who can view it, who can edit it? You define it yourself.
- 5It's free, completely free! — The Free Plan allows full usage at no cost.
12 Graph Types in Lark Dashboard (A Lot)
Basic Graphs (very commonly used)
| ประเภท | ใช้เมื่อไหร่ | ตัวอย่าง |
|---|---|---|
| Column Chart | อยากเทียบตัวเลขแต่ละช่วงนะ | ยอดขายแต่ละเดือน |
| Bar Chart | เทียบแบบแนวนอน อ่านง่ายมาก | ยอดขายแต่ละคน |
| Line Chart | ดูแนวโน้มว่าขึ้นหรือลงเลย | การเติบโตรายสัปดาห์ |
| Area Chart | ดูแนวโน้มพร้อมปริมาณรวม | Revenue รายไตรมาส |
| Pie Chart | ดูสัดส่วนว่าอันไหนมากสุดเลย | % ยอดขายแต่ละช่องทาง |
Advanced graphs (used for in-depth analysis).
| ประเภท | ใช้เมื่อไหร่ | ตัวอย่าง |
|---|---|---|
| Scatter Chart | หาว่า 2 อย่างนี้สัมพันธ์กันไหม | ราคา vs ยอดขาย |
| Radar Chart | เทียบหลายมิติพร้อมกันเลย | Performance Score ของคน |
| Combo Chart | ผสม Column กับ Line ใช้พร้อมกัน | ยอดขาย vs Target |
| Word Cloud | ดูว่าคำไหนโผล่บ่อยเลย | Feedback ลูกค้า |
Special blocks (make you look much more professional when used)
Metrics Block
Showcase impressive KPI figures, such as today's sales: ฿50,000.
Ranking List
Show the Top 10 rankings, such as who sells the best.
NPS Chart
Measuring Customer Satisfaction (Net Promoter Score)
Table View
Display data in a table format with filtering options.
How to Create a Lark Dashboard (Step by Step, Very Easy)
Prepare the data in Lark Base first.
ก่อนสร้าง Dashboard ต้องมีข้อมูลใน Lark BaseEN: {' '} ก่อนนะ ไม่งั้นไม่มีอะไรให้แส...ดูวิธีสร้าง Base)
Sales data example:
| Date | Product | Sales (฿) | Channel |
|---|---|---|---|
| 2025-12-01 | สินค้า A | 15,000 | LINE |
| 2025-12-01 | สินค้า B | 8,000 | TikTok |
Important tips:
- Every column must have a clear name; do not leave it blank.
- The date field must be used properly (not just typed in).
- Numbers must be entered in the Number Field (not as Text).
Let's create a new dashboard.
- 1. Open the Lark Base with the data.
- 2. Click on + (Add) On the left side
- 3. Choose Dashboard
- 4. Give it a unique name (e.g., "Report")
Add the first block (Metrics)
Let's start by presenting the key KPI numbers first.
- Click Add Block (top right corner)
- 2. Select Metrics
- 3. Set it up like this:
- • Data Source: Select the table to store the data.
- • Field: Select Sales (฿)
- • Summary: Select Sum (Total)
- 4. Press Done It's done!
Result: It will display a massive total sales figure, for example, "฿35.
Add Chart (Column Chart)
- 1. Press Add Block One more time.
- 2. Select Column Chart
- 3. Settings:
- • X-Axis: Select Date (Horizontal Axis)
- • Y-Axis: Select Sales (฿), Summary: Sum (Vertical Axis)
- 4. (If you want to look good) You can customize colors, legends, and number formats.
- 5. Press Done
Result: A beautiful bar graph displaying daily sales.
Design the layout beautifully.
- • Drag and drop. You can move the Block position freely.
- • Drag the corner. Resize it to fit perfectly.
- • Organize Metrics at the top, charts at the bottom.
Recommended layout (simple but looks great):
[Metrics: Total] [Metrics: Number of Orders] [Metrics]
Share the dashboard with the team.
- 1. Press Share (top right corner)
- 2. Select Rights:
- • Can View — View only (suitable for general teams)
- • Can Edit — Edit the Dashboard directly (suitable for close associates)
- • Can Manage - Manage permissions (suitable for Admin)
- 3. You can either copy the link or invite team members directly.
Advantages: People without a Lark Account can still view it. (If...)
Use Cases: Lark Dashboard for Thai Businesses
1. Sales Dashboard
Track sales.
Suitable for: Online store, sales team, e-commerce
Essential blocks to include:
- • Metrics: Sales today, this week, this month
- • Line Chart: Daily Sales Trend (See if it’s increasing or decreasing)
- • Pie Chart: Sales distribution by platform (clearly indicating that)
- • Ranking: Top 10 Best-Selling Products (Stay ahead of what's trending)
- • Bar Chart: Sales by Individual (Clearly shows who sells the best)
2. HR Dashboard
Team management
Suitable for: HR, Manager, Business Owner
Essential blocks to include:
- • Metrics: Team size, cumulative leave, total overtime
- • Pie Chart: Employee Distribution by Department (Visualizing the breakdown)
- • Bar Chart: Individual Performance Scores
- • Table: List of people nearing the end of their quota (prepared)
3. Operations Dashboard
Monitoring Operations
Suitable for: Warehouse, Retail, Logistics
Essential blocks to include:
- • Metrics: Total Orders Today, Pending, Shipped
- • Bar Chart: Order Status (to know how many pending tasks there are)
- • Line Chart: Weekly Orders (Trend Analysis)
- • Ranking: Products Running Low on Stock (Order Now Before They Run Out)
4. Marketing Dashboard
Campaign Measurement
Suitable for: Marketing team, Agency
Essential blocks to include:
- • Metrics: Leads Today, Conversion Rate, Ad Spend
- • Line Chart: Weekly Leads (View Growth Trends)
- • Pie Chart: Leads from Each Channel (Identifying Key Focus Areas)
- • Combo Chart: Ad Spend vs Leads (Know if it's worth it)
อ่านเพิ่มเติม: 5 Marketing KPIs ที่ธุรกิจไทยต้องติดตาม + แจก Dashboard Template ฟรี
You can try out the real Dashboard now.
Check out the sample Dashboard our team has created. Feel free to click, filter, and view the data interactively!
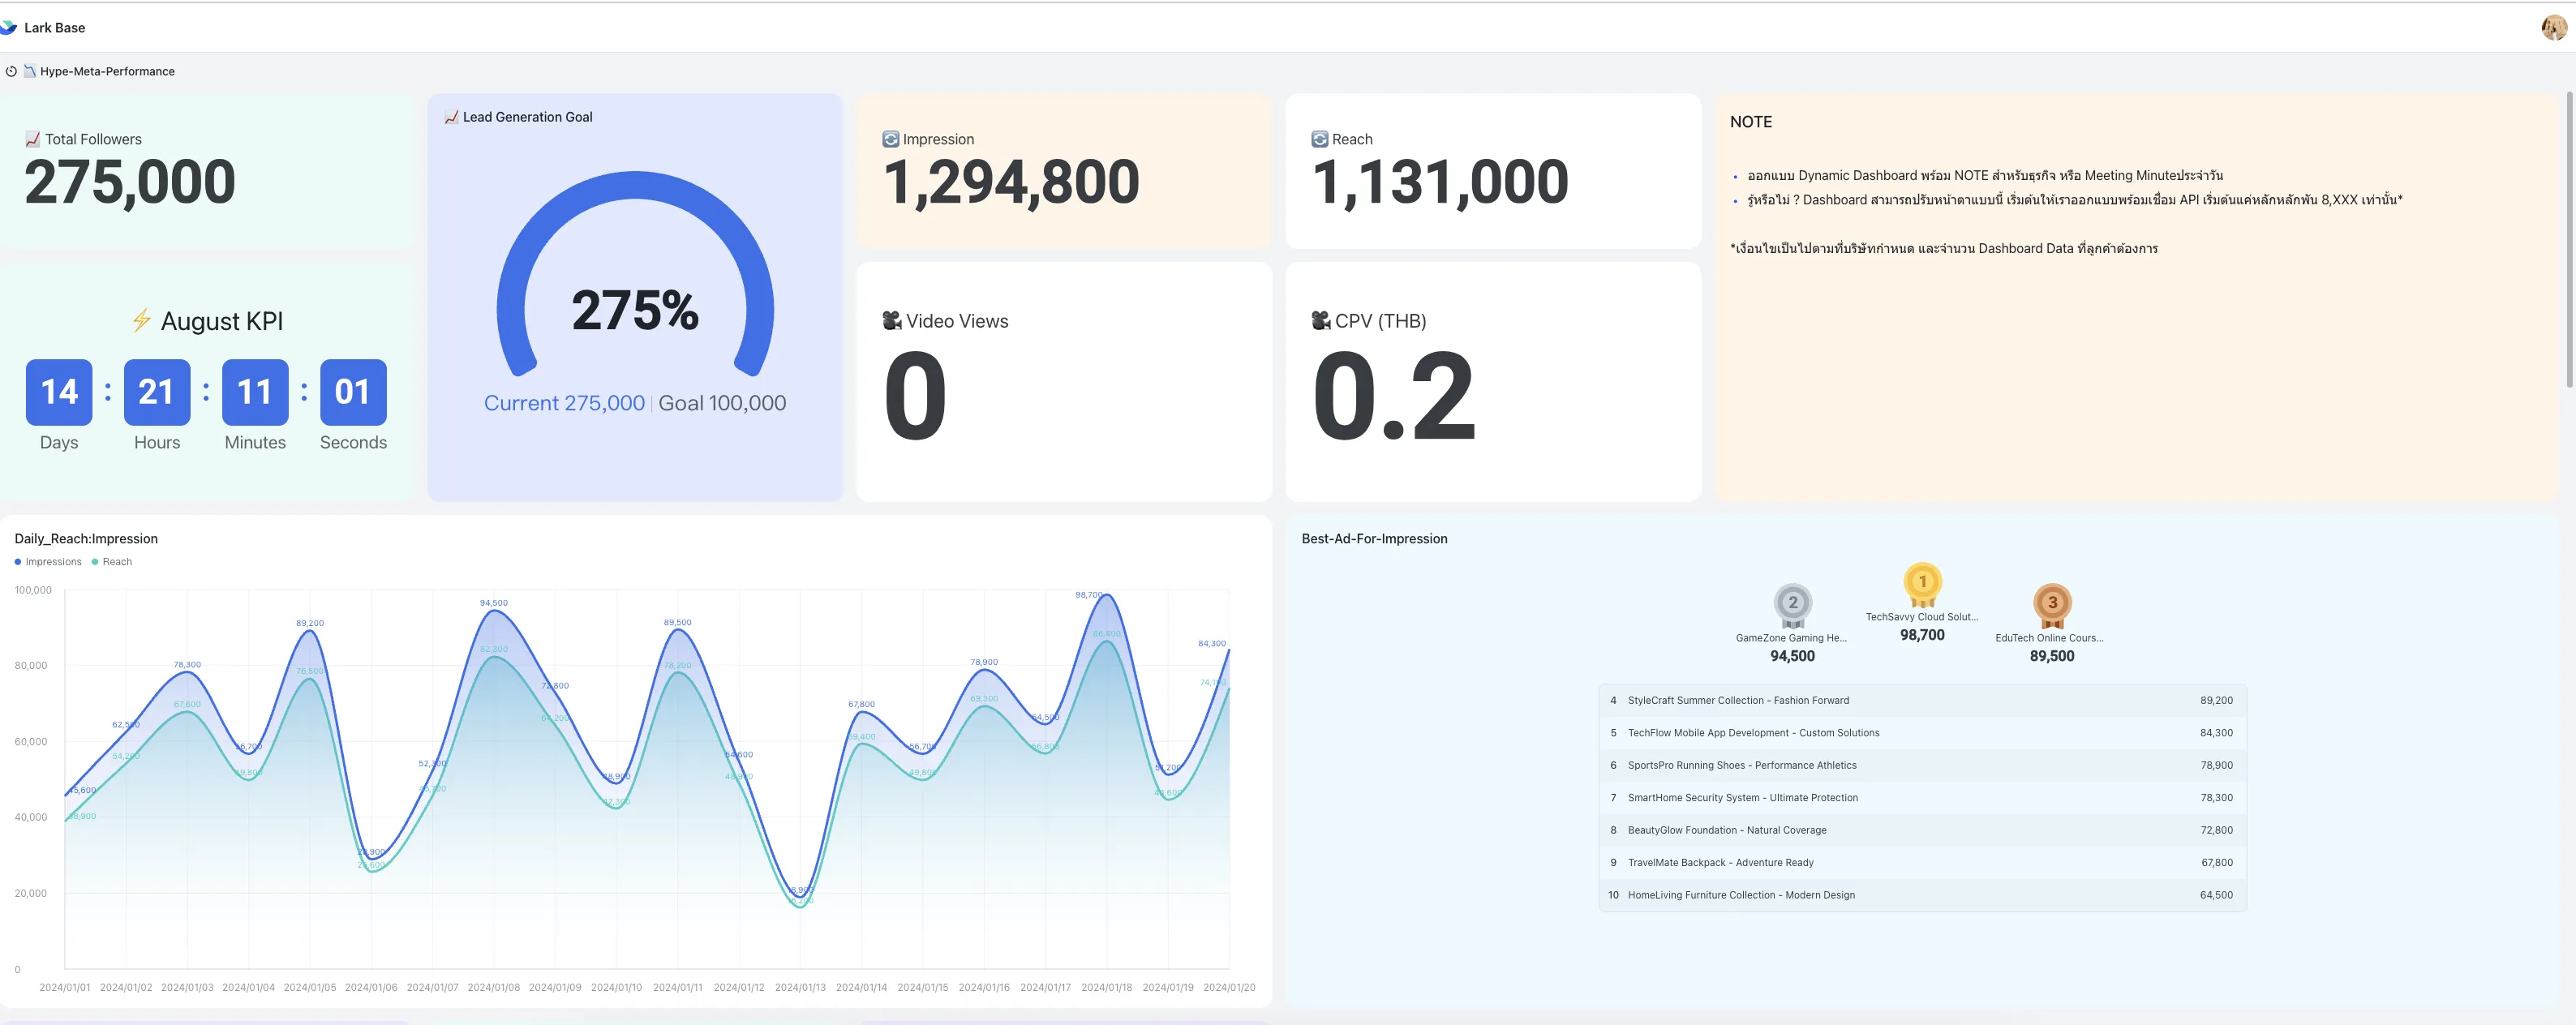
Performance Marketing Dashboard
Track ROI, ROAS, and Ad Spend in real-time.
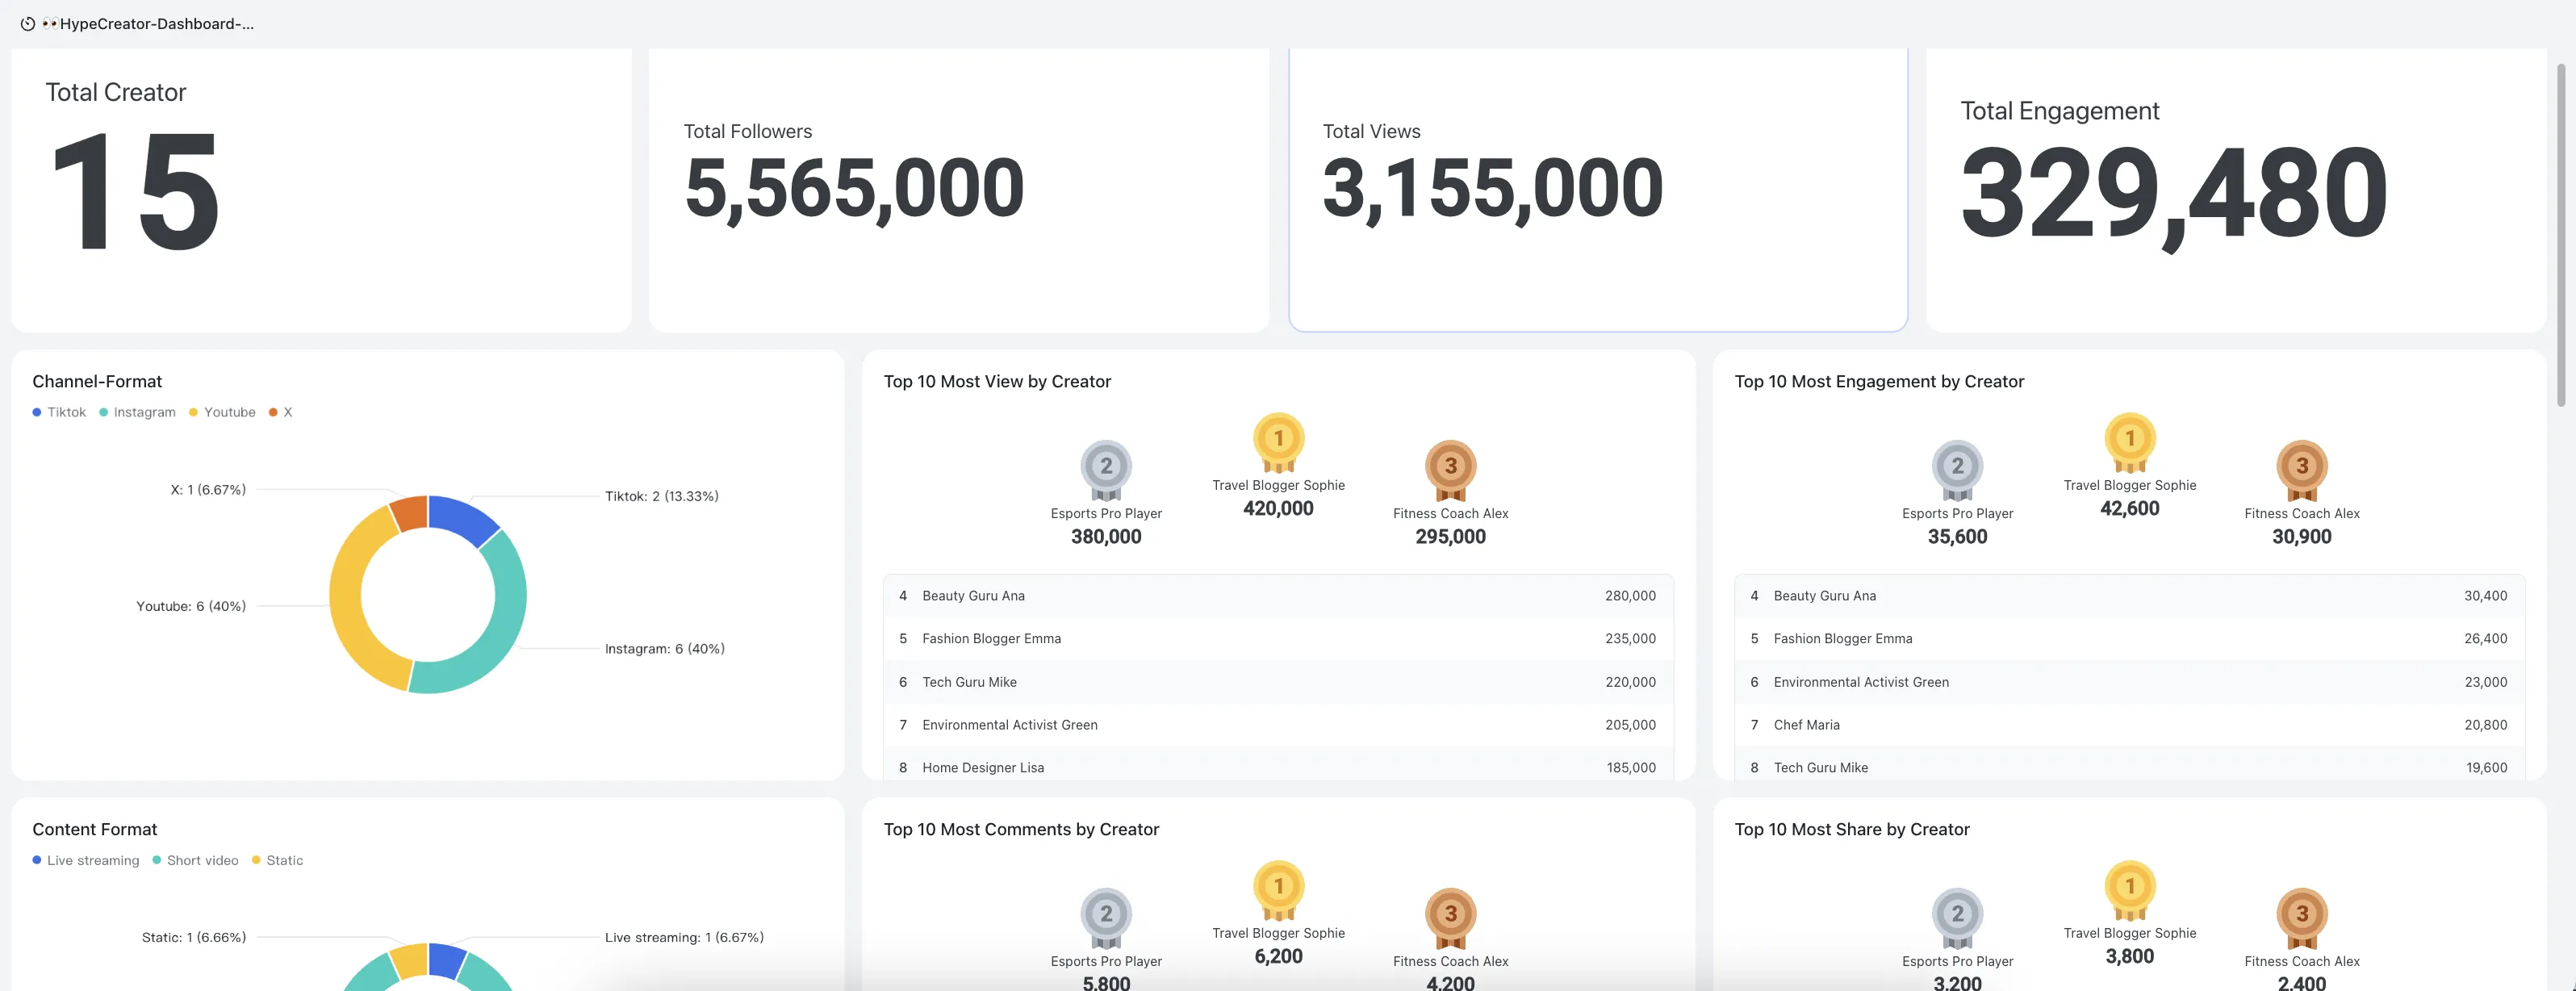
KOLs / Creator Tracking Dashboard
Monitor the performance of the influencer campaign.
Live Stream Template
Comprehensive Live Commerce Management
Live Stream Dashboard
Would you like to see additional sample dashboards?
We have many other free templates available for you to choose from.
Automation: Automatic notifications (no need to check constantly)
Lark Dashboard ทำงานร่วมกับ Lark AutomationEN: {' '} ได้นะ สะดวกมากเลย:...
| Trigger (เมื่อไหร่) | Action (ทำอะไร) |
|---|---|
| ยอดขายวันนี้ถึง ฿100,000 | ส่ง Notification ชื่นชมทีมเลย |
| Stock สินค้าเหลือ < 10 | ส่ง Alert ให้ฝ่ายจัดซื้อด่วนๆ เลย |
| มี Order ใหม่ | ส่ง Card ให้ทีม Shipping รีบจัดส่ง |
| KPI ต่ำกว่าเป้า | ส่ง Summary Report ให้ Manager ทราบเลย |
How to Set Up Automation
- 1. Go to Lark Base.
- 2. Click Automation (top right corner)
- 3. Create a New Rule:
- • Trigger: When a record is created/modified/field matches the criteria.
- • Condition: Field = X, or Date = Today
- • Action: Send Notification, Update Record, Create Record
Best Practices: Creating an Attractive Dashboard
Should do it immediately.
- 1. Starting with the main KPI. — Place the most important metrics at the top.
- 2. Use color to convey meaning. — Green = Good, Red = Bad, Yellow = Caution (people understand this)
- 3. Don't overdo it. — 6-8 blocks on the screen is just right; otherwise, it can get overwhelming.
- 4. Choose a name that is easy to understand. "Daily sales" is easy to understand, isn't it?
- 5. Add a filter for selection. - Allow viewers to choose their own time slots, offering much greater flexibility.
It shouldn't be done.
- 1. Do not overload with information. — A dashboard is not a 10-page lengthy report; it's meant to be read quickly.
- 2. Avoid using too many colors to prevent visual overload. The numerous colors can be confusing, making it hard to know what to focus on.
- 3. Don't forget to check on your mobile. — Check on mobile to ensure it's still readable.
- 4. Don't forget to set permissions. - Please ensure that only the intended recipients can see this. Don't forget!
Free Template: Feel free to use it!
เราทำ Lark Dashboard Template Here it is, feel free to use it:
| Template | รายละเอียด |
|---|---|
| 📊 Sales Dashboard | ติดตามยอดขาย, Channel, Top Products |
| 👥 HR Dashboard | จำนวนพนักงาน, ลา, Performance |
| 📦 Operations Dashboard | Orders, Stock, Shipping Status |
| 📈 Marketing KPI Dashboard | Leads, Conversion, Ad Spend |
Summary: Let's get started with Lark Dashboard.
Startup Checklist
- ☐ Sign up for a Lark Account for free →
- ☐ สร้าง Lark Base แรกเลย
- ☐ นำเข้าข้อมูลจาก Excel/CSV
- ☐ สร้าง Dashboard ตามขั้นตอนด้านบน
- ☐ ตั้งค่า Automation (ถ้าอยาก)
- ☐ แชร์ให้ทีมเริ่มใช้งานเลย
| Feature | Lark Dashboard |
|---|---|
| สร้าง Charts | ✅ Over 12 types available |
| Real-time Update | ✅ Update now! |
| Mobile Friendly | ✅ The app is ready to support. |
| แจ้งเตือนอัตโนมัติ | ✅ Automation is here. |
| ฟรี | ✅ Free Plan is available now. |
| ไม่ต้องเขียนโค้ด | ✅ Just drag and drop to finish! |
Are you ready to create your first dashboard?
Download the free template and start tracking your business information today!
Related Articles
5 Marketing KPIs That Thai Businesses Need to Monitor
Free Dashboard Template for ROI, ROAS, CAC, and LTV
Can AI really help with sales?
What SMEs Should Know Before Trying AI Tools
The Future of Creative Commerce in Thailand 2025
AI, Automation, and Engagement Creation
A lot of views but no sales?
5 Reasons and Practical Solutions
References & Official Resources
The information in this article is gathered from Lark Official Documentation and real user experiences with Thai businesses.
- Lark Official Website (Thailand)EN: {' '} — แพลตฟอร์ม collaboration สำหรับ...
- Lark Base Product PageEN: {' '} — ฐานข้อมูลและ Dashboard...
- Lark Help Center (Thai)EN: {' '} — คู่มือการใช้งานภาษาไทย...
- Lark Base - Getting Started GuideEN: {' '} — วิธีสร้าง Base เบื้องต้น...
- Insert Base in DocsEN: {' '} — วิธีฝัง Base ในเอกสาร...
- Lark Automation DocumentationEN: {' '} — วิธีตั้งค่าแจ้งเตือนอัตโนมัติ...
- 🎁 Sign up for Lark for free (iOS/Android/Desktop)EN: {' '} — ดาวน์โหลดแอปพลิเคชัน...
Latest update: December 2025


